
DevOps: Netflix Clone Deployment
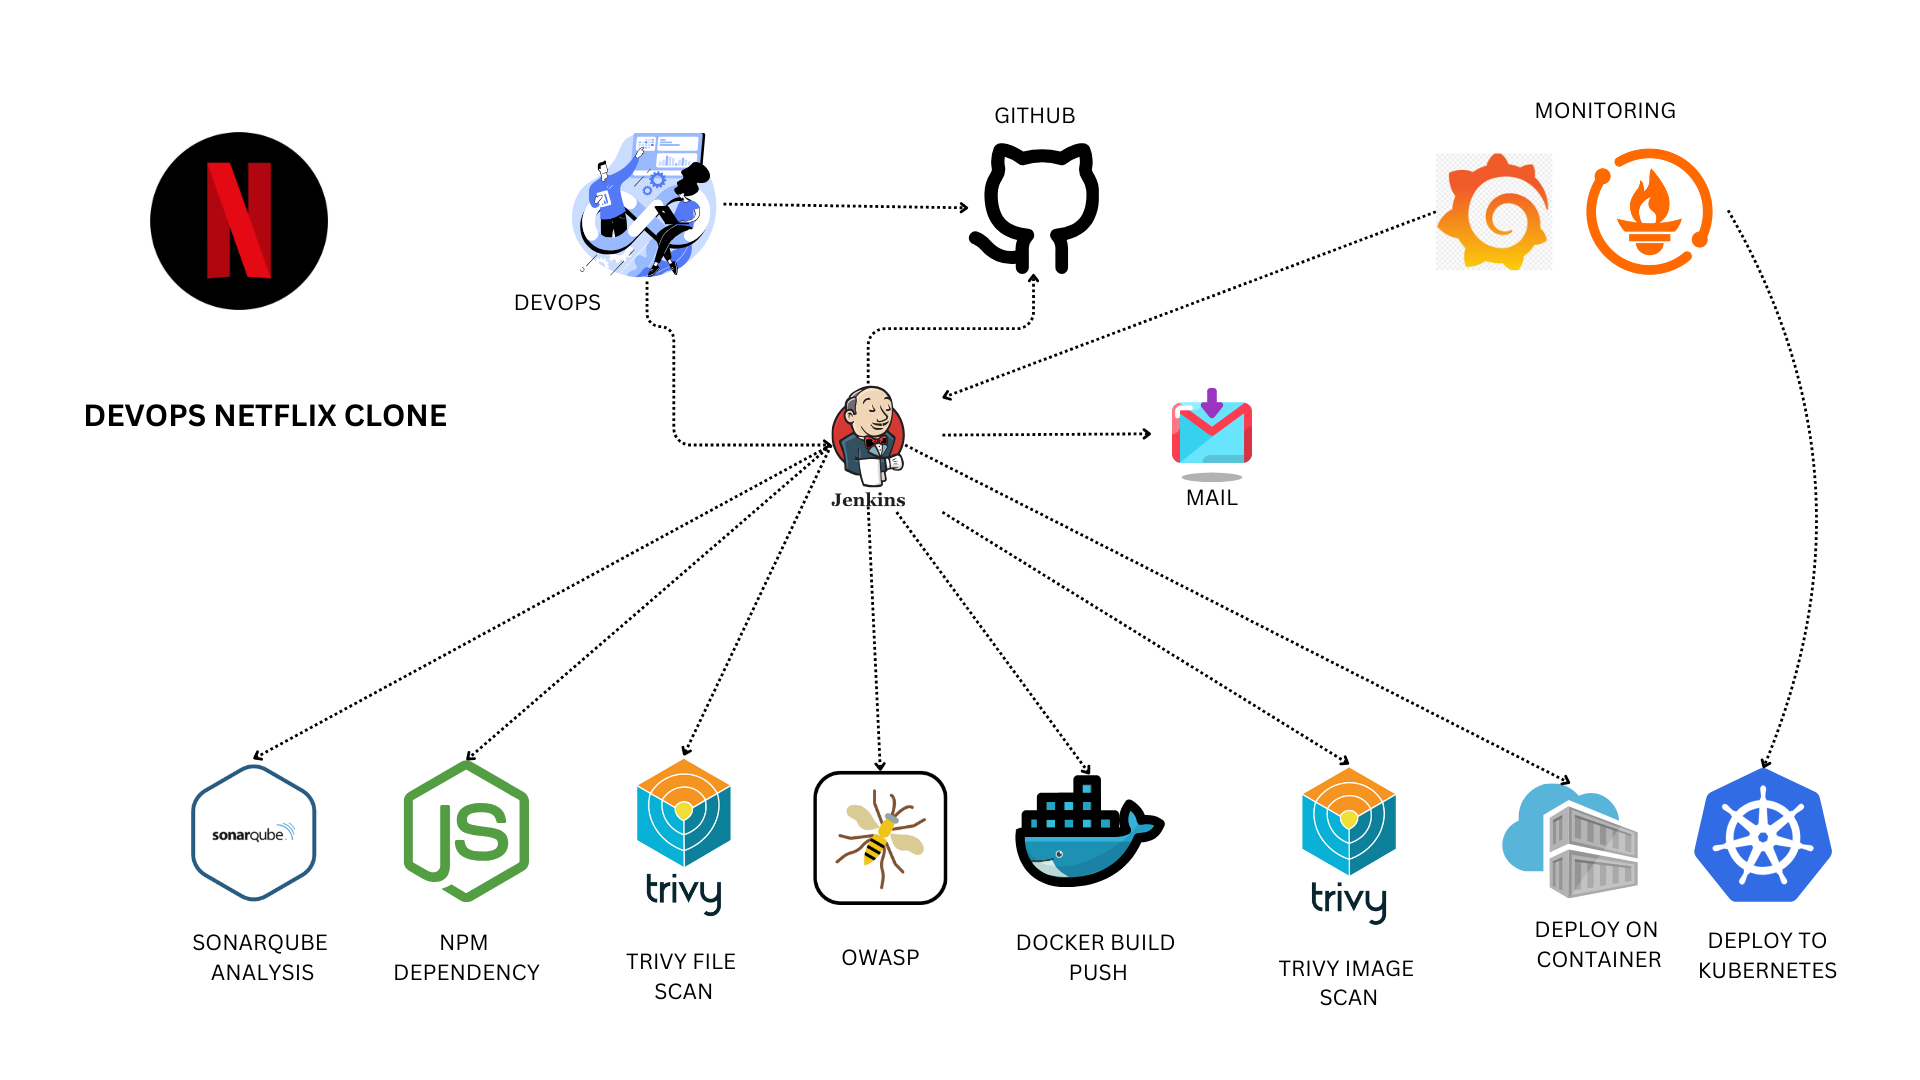
I’m deploying a private cloud project featuring a Netflix clone from an external repository. This project is a learning platform for new tools I didn’t explore during my AWS and Azure courses. For CI/CD, I am utilizing Jenkins, and the application runs within a Docker container managed via a Kubernetes cluster. I’m monitoring Jenkins and Kubernetes metrics using Grafana, Prometheus, and Node Exporter. I hope this detailed description of my project setup proves helpful. Methodologies from Mr. Cloud Book inspire this project.
Tools and Technologies
Jenkins
Jenkins is an open-source automation server that facilitates continuous integration and continuous delivery (CI/CD). It automates the process of building, testing, and deploying applications, thereby improving software development efficiency. In this project, Jenkins was used to set up a CI/CD pipeline that automated the steps from code checkout to deployment.
Docker
The Docker platform uses containerization to create, deploy, and manage applications. Containers are lightweight and portable and ensure consistency across multiple development and release cycles. Docker was used to containerize the Netflix clone application, making it easier to manage dependencies and provide a consistent runtime environment.
Kubernetes
Kubernetes is an open-source platform designed to automate application container deployment, scaling, and operation. Kubernetes clusters can manage the lifecycle of containers and services, providing load balancing, scaling, and automated rollouts and rollbacks. This project used Kubernetes to orchestrate deploying the Docker containers running the Netflix clone application.
Prometheus
Prometheus is an open-source monitoring and alerting toolkit. It is particularly well-suited for monitoring dynamic environments like Kubernetes. Prometheus was set up to monitor Jenkins and the Kubernetes cluster, collecting metrics and providing insights into the infrastructure’s performance and health.
Grafana
Grafana is an open-source platform for monitoring and observability. It provides a powerful and flexible dashboard for visualizing metrics from various data sources, including Prometheus. In this project, Grafana created visual dashboards to monitor the health and performance of the Jenkins server and Kubernetes cluster.
Trivy
Trivy is a comprehensive and easy-to-use vulnerability scanner for containers. It detects vulnerabilities in OS packages and application dependencies. In this project, Trivy was used to scan the application for vulnerabilities, ensuring that any security issues were identified and addressed before deployment.
SonarQube Scanner
SonarQube Scanner is a tool for continuous inspection of code quality. It performs automatic reviews to detect bugs, code smells, and security vulnerabilities. In this project, SonarQube was used to analyze the code quality of the Netflix clone application as part of the CI/CD pipeline.
OWASP Dependency Check
OWASP Dependency Check is a software composition analysis (SCA) tool that identifies project dependencies and checks for known, publicly disclosed vulnerabilities. It was integrated into the pipeline to ensure that all dependencies used in the project were secure and up to date.
Steps for this project:
- Launch an Ubuntu 22.04 T2 Large Instance.
- Install Jenkins, Docker, and Trivy; create a Sonarqube container using Docker.
- Obtain a TMDB API key.
- Install Prometheus and Grafana on the new server.
- Add the Prometheus plugin to Jenkins and integrate it with the Prometheus server.
- Set up email integration in Jenkins and configure the necessary plugins.
- Install additional plugins such as JDK, Sonarqube Scanner, and Node.js.
- Configure Sonar Server.
- Install OWASP Dependency Check plugins in Jenkins.
- Build and push a Docker image.
- Set up Kubernetes master and slave nodes on Ubuntu 20.04.
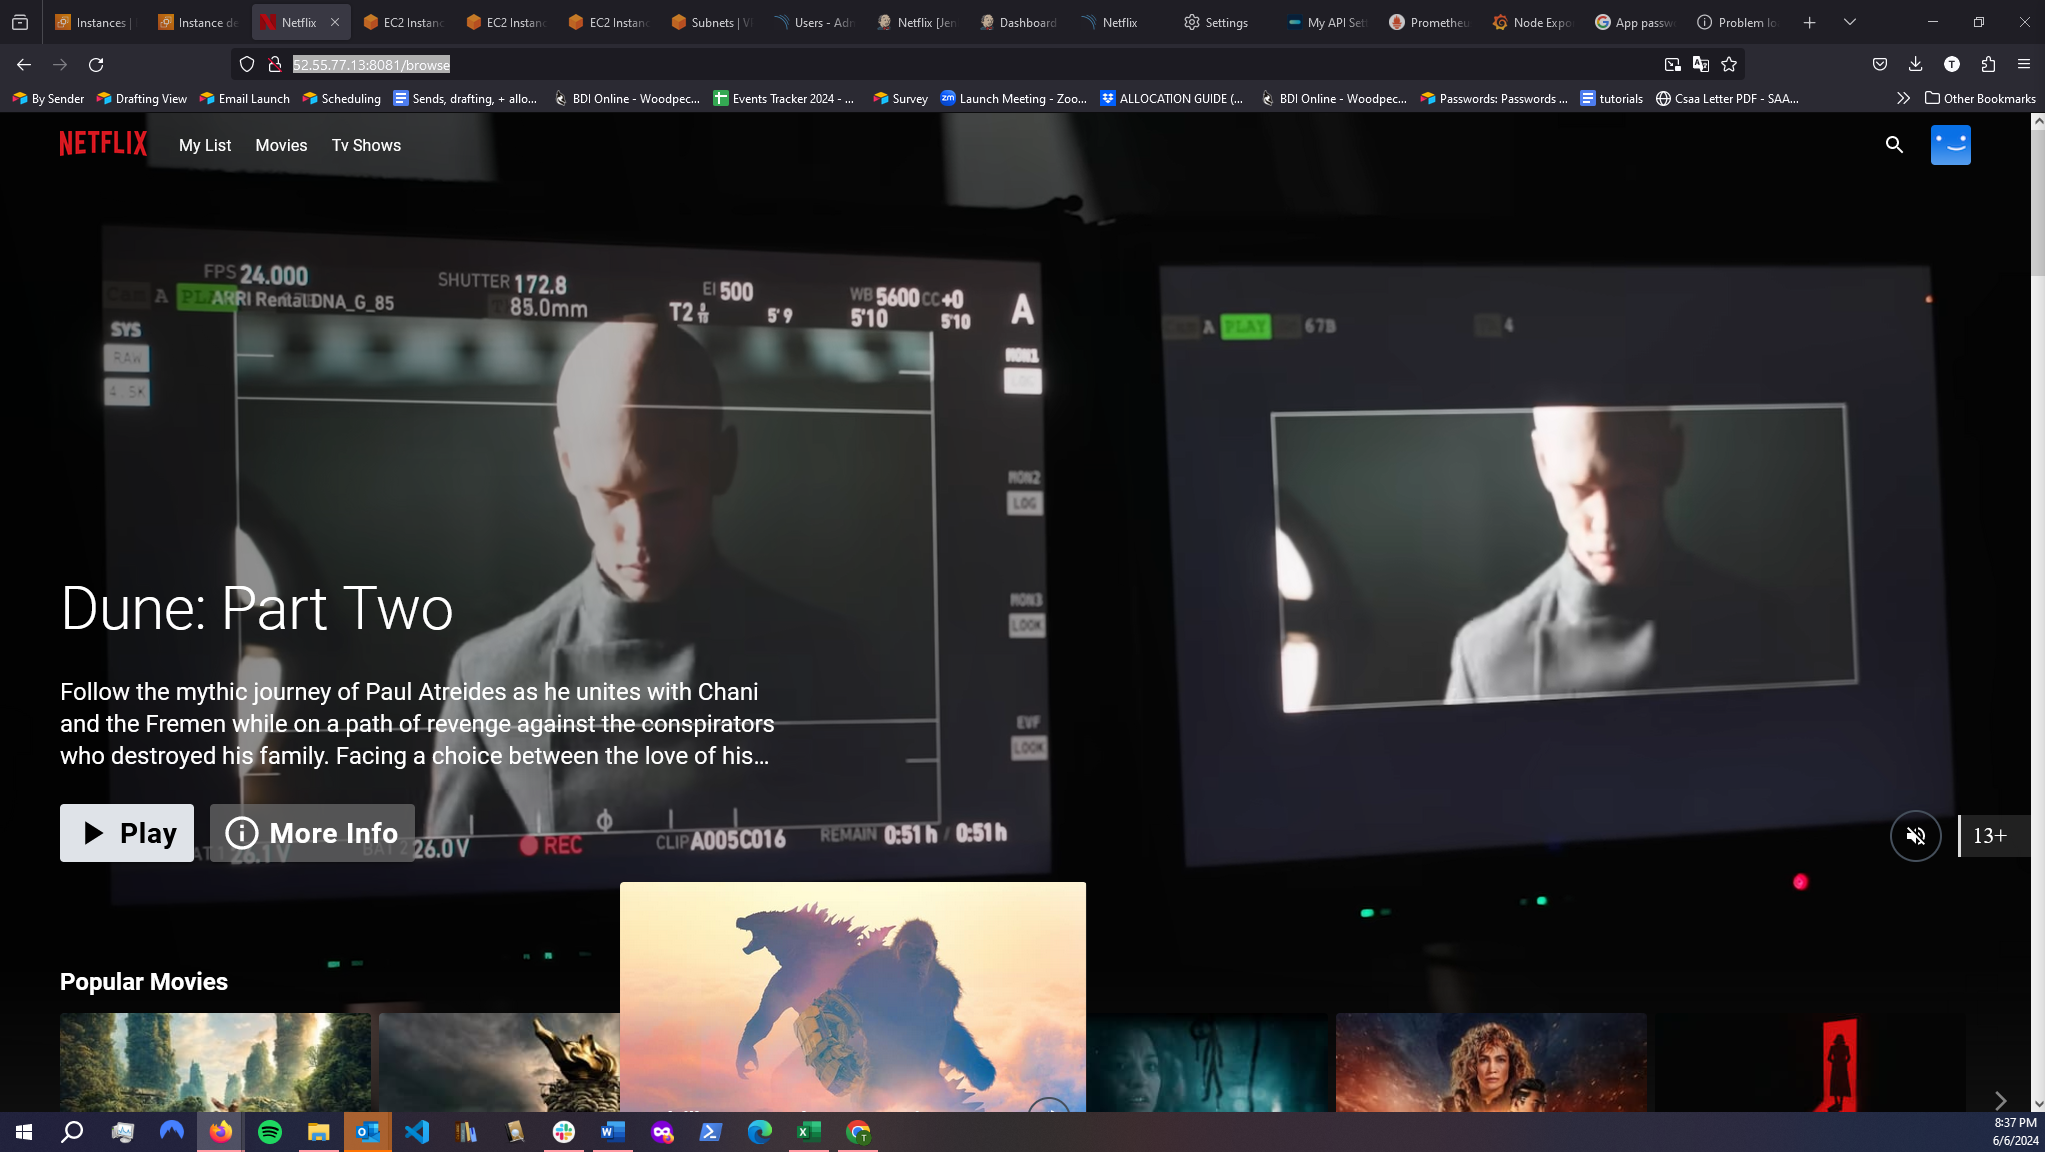
- Access the Netflix clone application via a web browser.
Step 1: Launch an Ubuntu 22.04 T2 Large Instance
This bash script was added to the user data in the instance console.
#!/bin/bash
sudo apt update -y
#sudo apt upgrade -y
wget -O - https://packages.adoptium.net/artifactory/api/gpg/key/public | tee /etc/apt/keyrings/adoptium.asc
echo "deb [signed-by=/etc/apt/keyrings/adoptium.asc] https://packages.adoptium.net/artifactory/deb $(awk -F= '/^VERSION_CODENAME/{print$2}' /etc/os-release) main" | tee /etc/apt/sources.list.d/adoptium.list
sudo apt update -y
sudo apt install temurin-17-jdk -y
/usr/bin/java --version
curl -fsSL https://pkg.jenkins.io/debian-stable/jenkins.io-2023.key | sudo tee \
                  /usr/share/keyrings/jenkins-keyring.asc > /dev/null
echo deb [signed-by=/usr/share/keyrings/jenkins-keyring.asc] \
                  https://pkg.jenkins.io/debian-stable binary/ | sudo tee \
                              /etc/apt/sources.list.d/jenkins.list > /dev/null
sudo apt-get update -y
sudo apt-get install jenkins -y
sudo systemctl start jenkins
sudo systemctl status jenkinsSince Jenkins runs on port 8080, I configured the security group for the ‘Netflix-Jenkins’ server to allow inbound traffic on port 8080. Additionally, I opened port 22 to enable SSH access to the server

Step 2: Install Jenkins, Docker, and Trivy; create a Sonarqube container using Docker
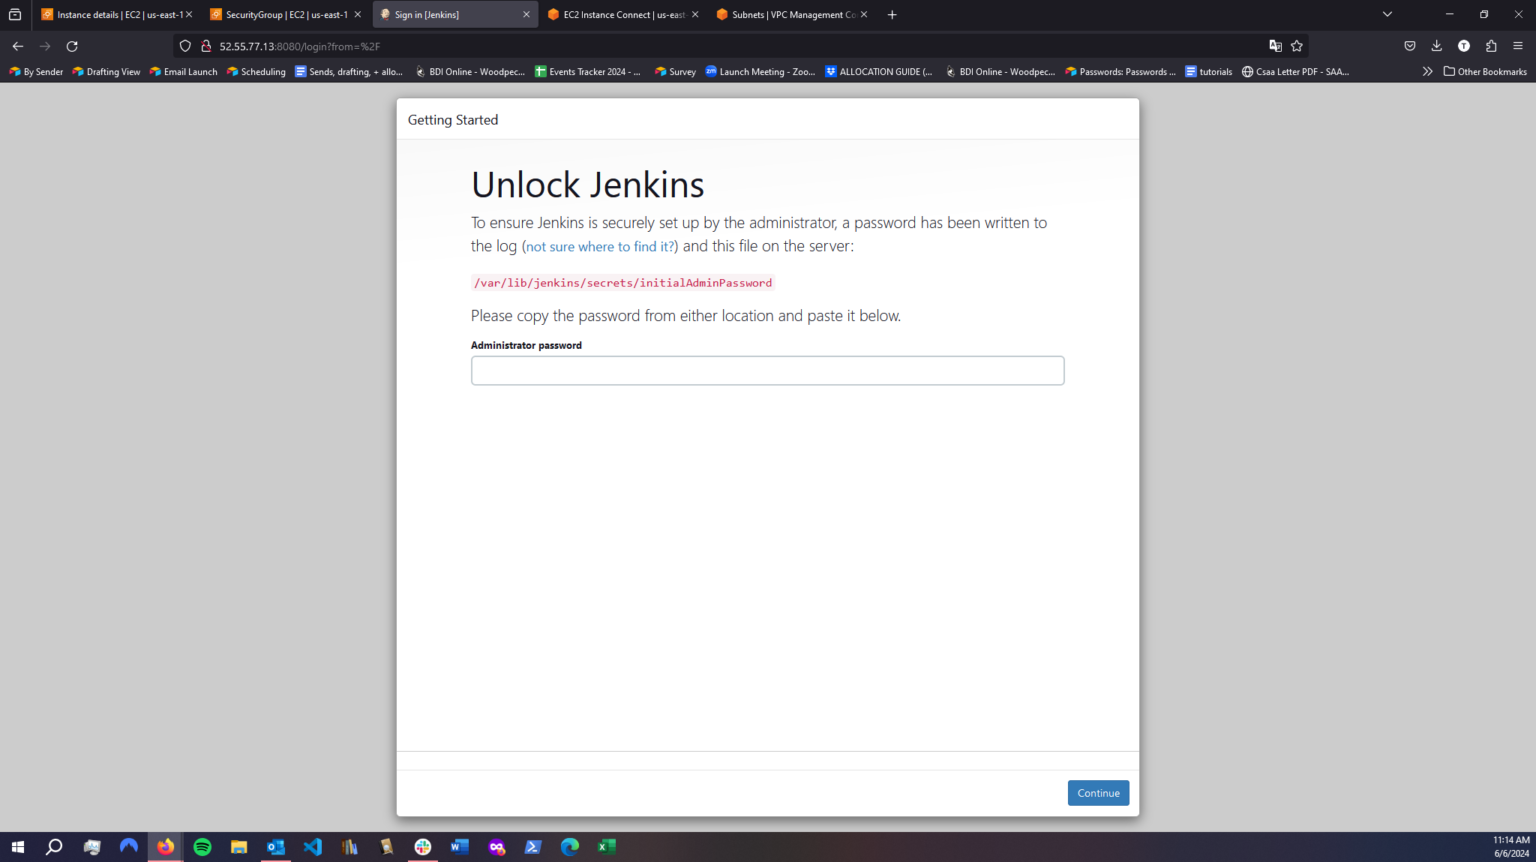
After starting up the server with Jenkins installed, I needed to retrieve the initial admin password to complete the Jenkins setup process.
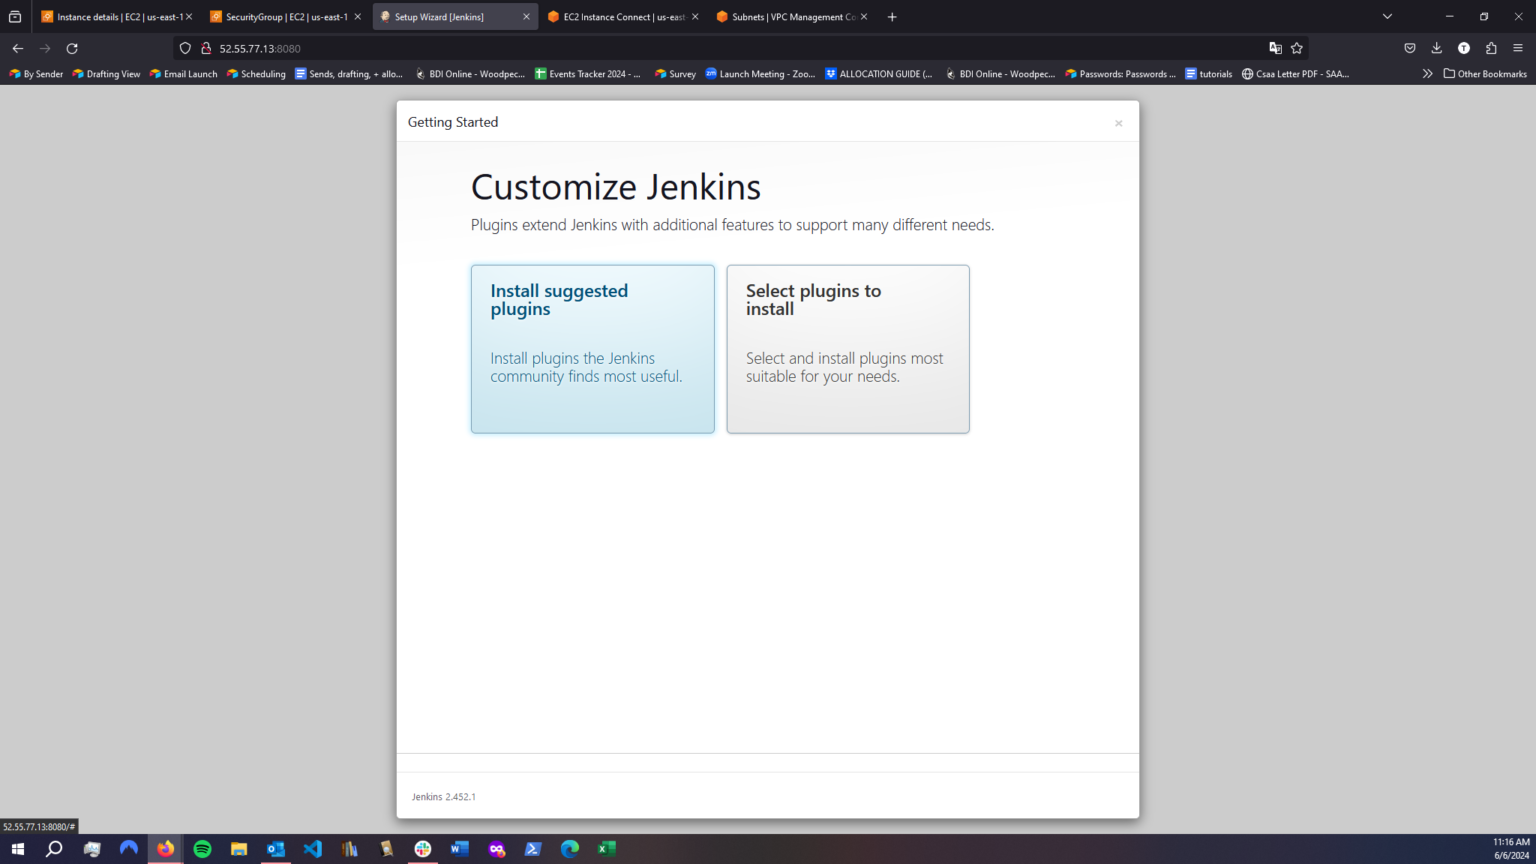
I then needed to install the suggested plugins
I needed to create an Admin User, and then Jenkins was ready to be used.

I then needed to install docker.
sudo apt-get update
sudo apt-get install docker.io -y
sudo usermod -aG docker $USER
newgrp docker
sudo chmod 777 /var/run/docker.sockAfter installing Docker, I deployed a SonarQube container and configured the security group of the ‘Netflix-Jenkins’ server to allow inbound traffic on port 9000. This setup enables SonarQube to connect to the server.
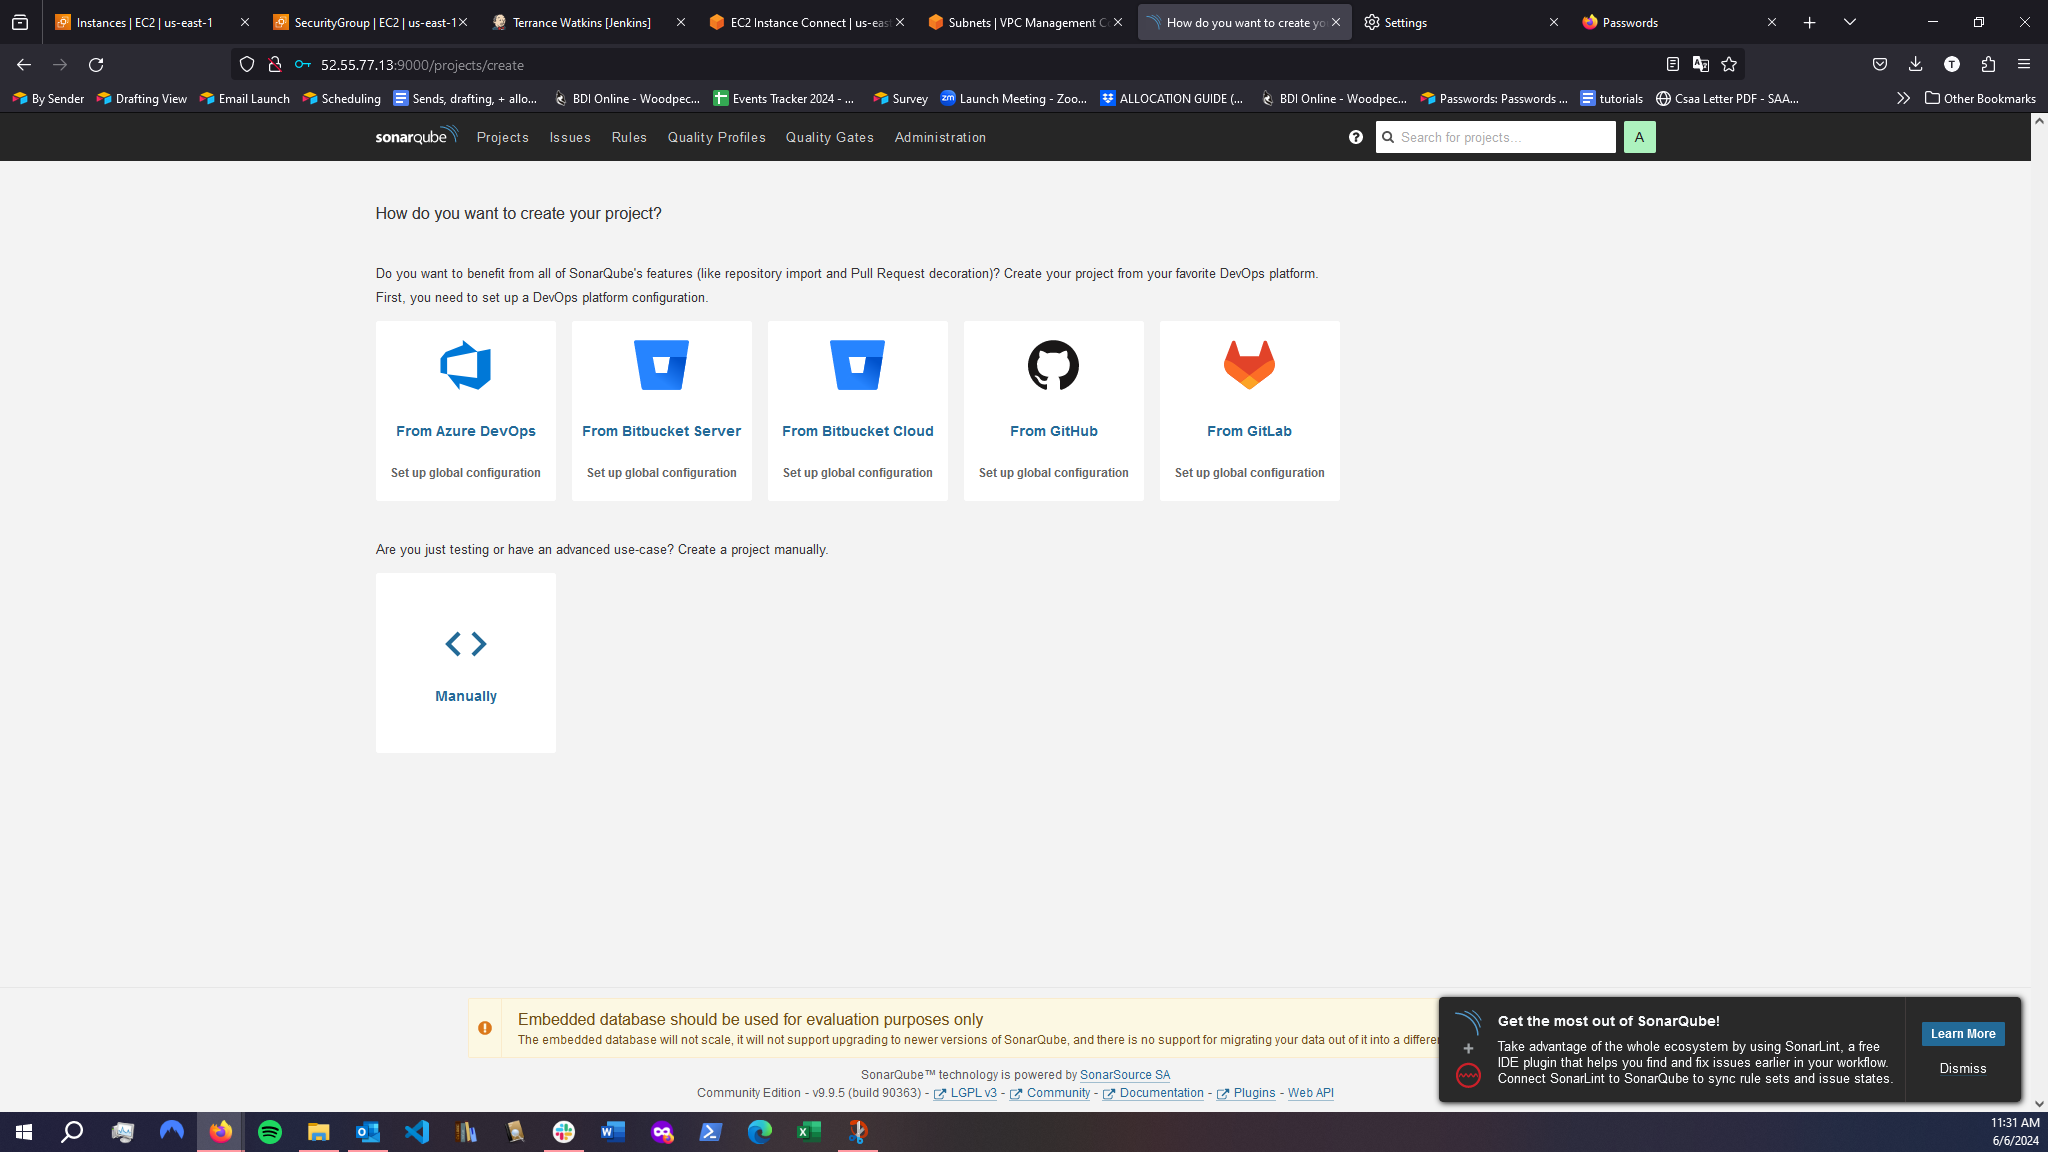
docker run -d --name sonar -p 9000:9000 sonarqube:lts-communityAfter successfully launching SonarQube, I accessed it by entering http:// into the browser’s URL bar. After logging in with my username and password, I reached the dashboard.
Once SonarQube was installed, I installed Trivy but using a shell script:
sudo apt-get install wget apt-transport-https gnupg lsb-release -y
wget -qO - https://aquasecurity.github.io/trivy-repo/deb/public.key | gpg --dearmor | sudo tee /usr/share/keyrings/trivy.gpg > /dev/null
echo "deb [signed-by=/usr/share/keyrings/trivy.gpg] https://aquasecurity.github.io/trivy-repo/deb $(lsb_release -sc) main" | sudo tee -a /etc/apt/sources.list.d/trivy.list
sudo apt-get update
sudo apt-get install trivy -yStep 3: Obtain a TMDB API key
TMDB stands for The Movie Database, and an API key is essential for the Netflix clone to function. To obtain an API key, I first created an account on TMDB. Then, I navigated to ‘Settings’ > ‘API’ > ‘Create’ and selected ‘Developer.’ After providing the required basic details, I received the API key.
Step 4: Install Prometheus and Grafana on the new server
I created and launched a t2.medium EC2 instance and created a system user and downloaded Prometheus to scrape metrics from Jenkins.
sudo useradd \
    --system \
    --no-create-home \
--shell /bin/false prometheusStep 4: Install Prometheus and Grafana on the new server
I created and launched a t2.medium EC2 instance and created a system user.
wget https://github.com/prometheus/prometheus/releases/download/v2.47.1/prometheus-2.47.1.linux-amd64.tar.gz
tar -xvf prometheus-2.47.1.linux-amd64.tar.gz
sudo mv prometheus-2.47.1.linux-amd64/prometheus /usr/local/bin/
sudo mv prometheus-2.47.1.linux-amd64/promtool /usr/local/bin/
sudo mkdir -p /etc/prometheus /data
sudo mv prometheus-2.47.1.linux-amd64/prometheus.yml /etc/prometheus/
sudo chown -R prometheus:prometheus /etc/prometheus /dataScript Explanation:
Step 1: Downloading Prometheus I started by downloading the latest version of Prometheus designed for Linux systems with AMD64 architecture. Using a command-line utility, I fetched the package directly from Prometheus’s official GitHub repository.
Step 2: Extracting the Archive Once downloaded, I extracted the archive. This process unpacked all the essential files required for Prometheus to function.
Step 3: Moving Prometheus Binaries Next, I moved the main executable files of Prometheus to a standard directory on my system. This made the software accessible system-wide, allowing me to execute Prometheus commands easily without needing to specify the full path.
Step 4: Creating Directories I then created specific directories to organize Prometheus’s configuration files and data. This step is vital as it helps in systematic configuration management and ensures that Prometheus has its dedicated space for operational data.
Step 5: Moving the Configuration File After setting up the directories, I moved the default configuration file of Prometheus to its new designated directory. This action is crucial because it enables me to customize Prometheus according to my specific monitoring requirements.
Step 6: Setting Ownership To wrap up the setup, I adjusted the ownership of the directories and files I had created and moved. This ensured that Prometheus would operate under the correct user permissions, enhancing the security by limiting rights to these essential files and folders.
Next I needed to create and configure a Systemd Unit configuration file.
sudo vim /etc/systemd/system/prometheus.service[Unit]
Description=Prometheus
Wants=network-online.target
After=network-online.target
StartLimitIntervalSec=500
StartLimitBurst=5
[Service]
User=prometheus
Group=prometheus
Type=simple
Restart=on-failure
RestartSec=5s
ExecStart=/usr/local/bin/prometheus \
--config.file=/etc/prometheus/prometheus.yml \
--storage.tsdb.path=/data \
--web.console.templates=/etc/prometheus/consoles \
--web.console.libraries=/etc/prometheus/console_libraries \
--web.listen-address=0.0.0.0:9090 \
--web.enable-lifecycle
[Install]
WantedBy=multi-user.targetUnderstanding the Prometheus Service File on Linux Systems
When setting up Prometheus on a Linux system, you might encounter a configuration file known as a systemd service unit file. This file tells the system how to manage the Prometheus service—everything from when to start it, who should run it, and what to do if it stops unexpectedly. Here’s a breakdown of what goes into this file and what it means for your Prometheus setup:
Basic Configuration
The file is divided into sections, each with a specific purpose:
[Unit] Section: This part of the file describes the service. It tells the system that Prometheus depends on the network being available. Hence, it ensures that the network is online before Prometheus starts. Additionally, it prevents the service from restarting too often, specifying that if the service fails five times within 500 seconds, it should stop attempting to restart.
[Service] Section: Here, you define how Prometheus should run:
- User and Group: Prometheus runs as a specific user (
prometheus), ensuring it doesn’t have more permissions than necessary. - Type: The service type is set to
simple, indicating that it starts as soon as the command is run and doesn’t fork or spawn child processes. - Restart Conditions: If Prometheus fails, it’s set to restart automatically unless it’s stopped manually. There’s a five-second pause before it restarts.
- ExecStart: This line is crucial—it’s the command that starts Prometheus. It includes several flags configuring where Prometheus finds its configuration files, where it stores data, and the network settings it should use to expose its web interface.
- User and Group: Prometheus runs as a specific user (
Network and API Settings
- Prometheus is configured to listen on all network interfaces (
0.0.0.0) on port9090, making it accessible from other machines. - The
--web.enable-lifecycleflag allows some web API endpoints to be available that can manage the lifecycle of the Prometheus instance.
Startup Behavior
- [Install] Section: This specifies that the service should be associated with
multi-user.target, which is a standard configuration for services that need to be available whenever multiple users are logged into the system.
Why It Matters
Using a systemd service file provides a reliable and standardized way to manage how Prometheus runs on your system. It ensures that Prometheus starts safely after the network is ready, runs with the correct permissions, and restarts automatically in case of failure—keeping your monitoring system robust and less prone to prolonged downtime.
sudo systemctl enable prometheus
sudo systemctl start prometheus
sudo systemctl status prometheus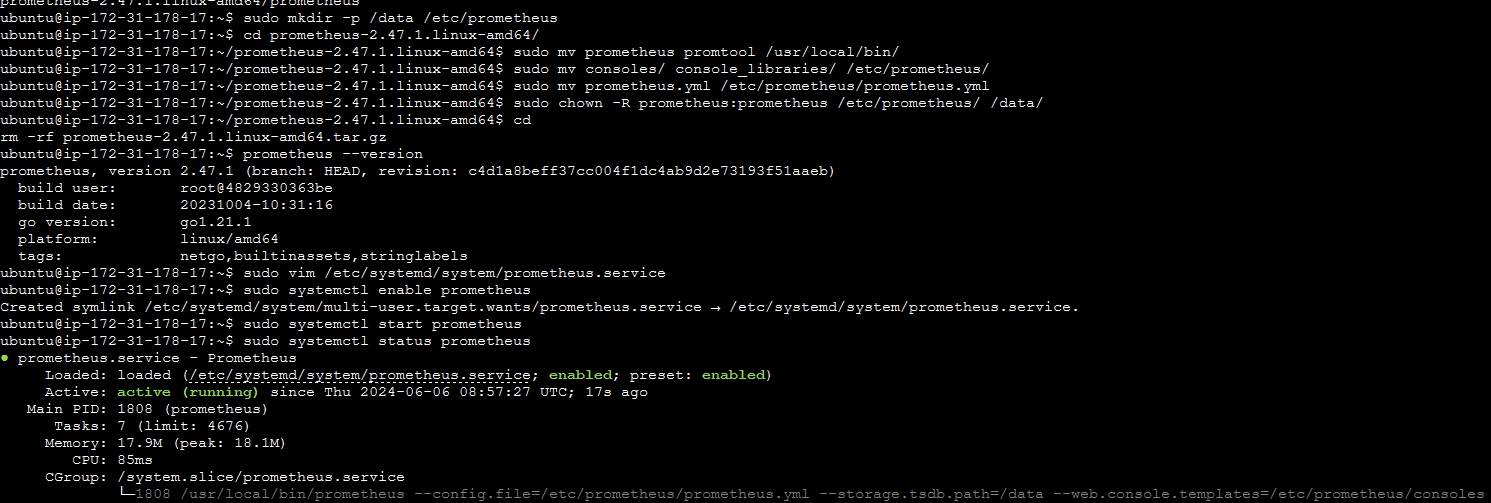
Next I installed Node Exporter to collect system metrics:
sudo useradd --system --no-create-home --shell /bin/false node_exporter
wget https://github.com/prometheus/node_exporter/releases/download/v1.6.1/node_exporter-1.6.1.linux-amd64.tar.gz
tar -xvf node_exporter-1.6.1.linux-amd64.tar.gz
sudo mv node_exporter-1.6.1.linux-amd64/node_exporter /usr/local/bin/
Then Node Exporter needs to be configured:
sudo vim /etc/systemd/system/node_exporter.service

[Unit]
Description=Node Exporter
Wants=network-online.target
After=network-online.target

[Service]
User=node_exporter
Group=node_exporter
Type=simple
Restart=on-failure
RestartSec=5s
ExecStart=/usr/local/bin/node_exporter

[Install]
WantedBy=multi-user.target
Node Exporter can be started now:
sudo systemctl enable node_exporter
sudo systemctl start node_exporter
sudo systemctl status node_exporter

In Prometheus’ YAML file I needed to update the config file and add a static target for Node Exporter:
# my global config
global:
scrape_interval: 15s # Set the scrape interval to every 15 seconds. Default is every 1 minute.
evaluation_interval: 15s # Evaluate rules every 15 seconds. The default is every 1 minute.
# scrape_timeout is set to the global default (10s).
# Alertmanager configuration
alerting:
alertmanagers:
– static_configs:
– targets:
# – alertmanager:9093
# Load rules once and periodically evaluate them according to the global ‘evaluation_interval’.
rule_files:
# – “first_rules.yml”
# – “second_rules.yml”
# A scrape configuration containing exactly one endpoint to scrape:
# Here it’s Prometheus itself.
scrape_configs:
# The job name is added as a label `job=
– job_name: “prometheus”
# metrics_path defaults to ‘/metrics’
# scheme defaults to ‘http’.
static_configs:
– targets: [“localhost:9090”]
– job_name: node_export
static_configs: node export
– targets: [“localhost:9100”]

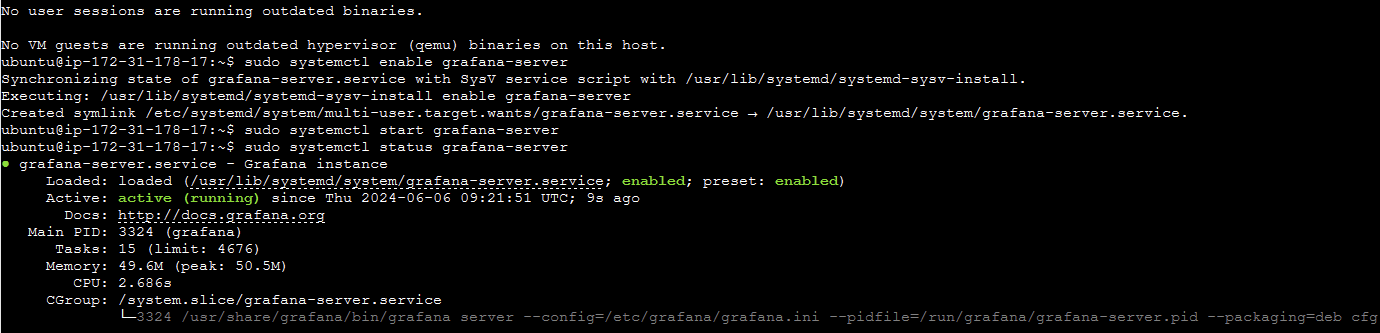
I then needed to install Grafana:
sudo apt-get install -y apt-transport-https software-properties-common
wget -q -O - https://packages.grafana.com/gpg.key | sudo apt-key add -
echo "deb https://packages.grafana.com/oss/deb stable main" | sudo tee -a /etc/apt/sources.list.d/grafana.list
sudo apt-get update
sudo apt-get -y install grafana
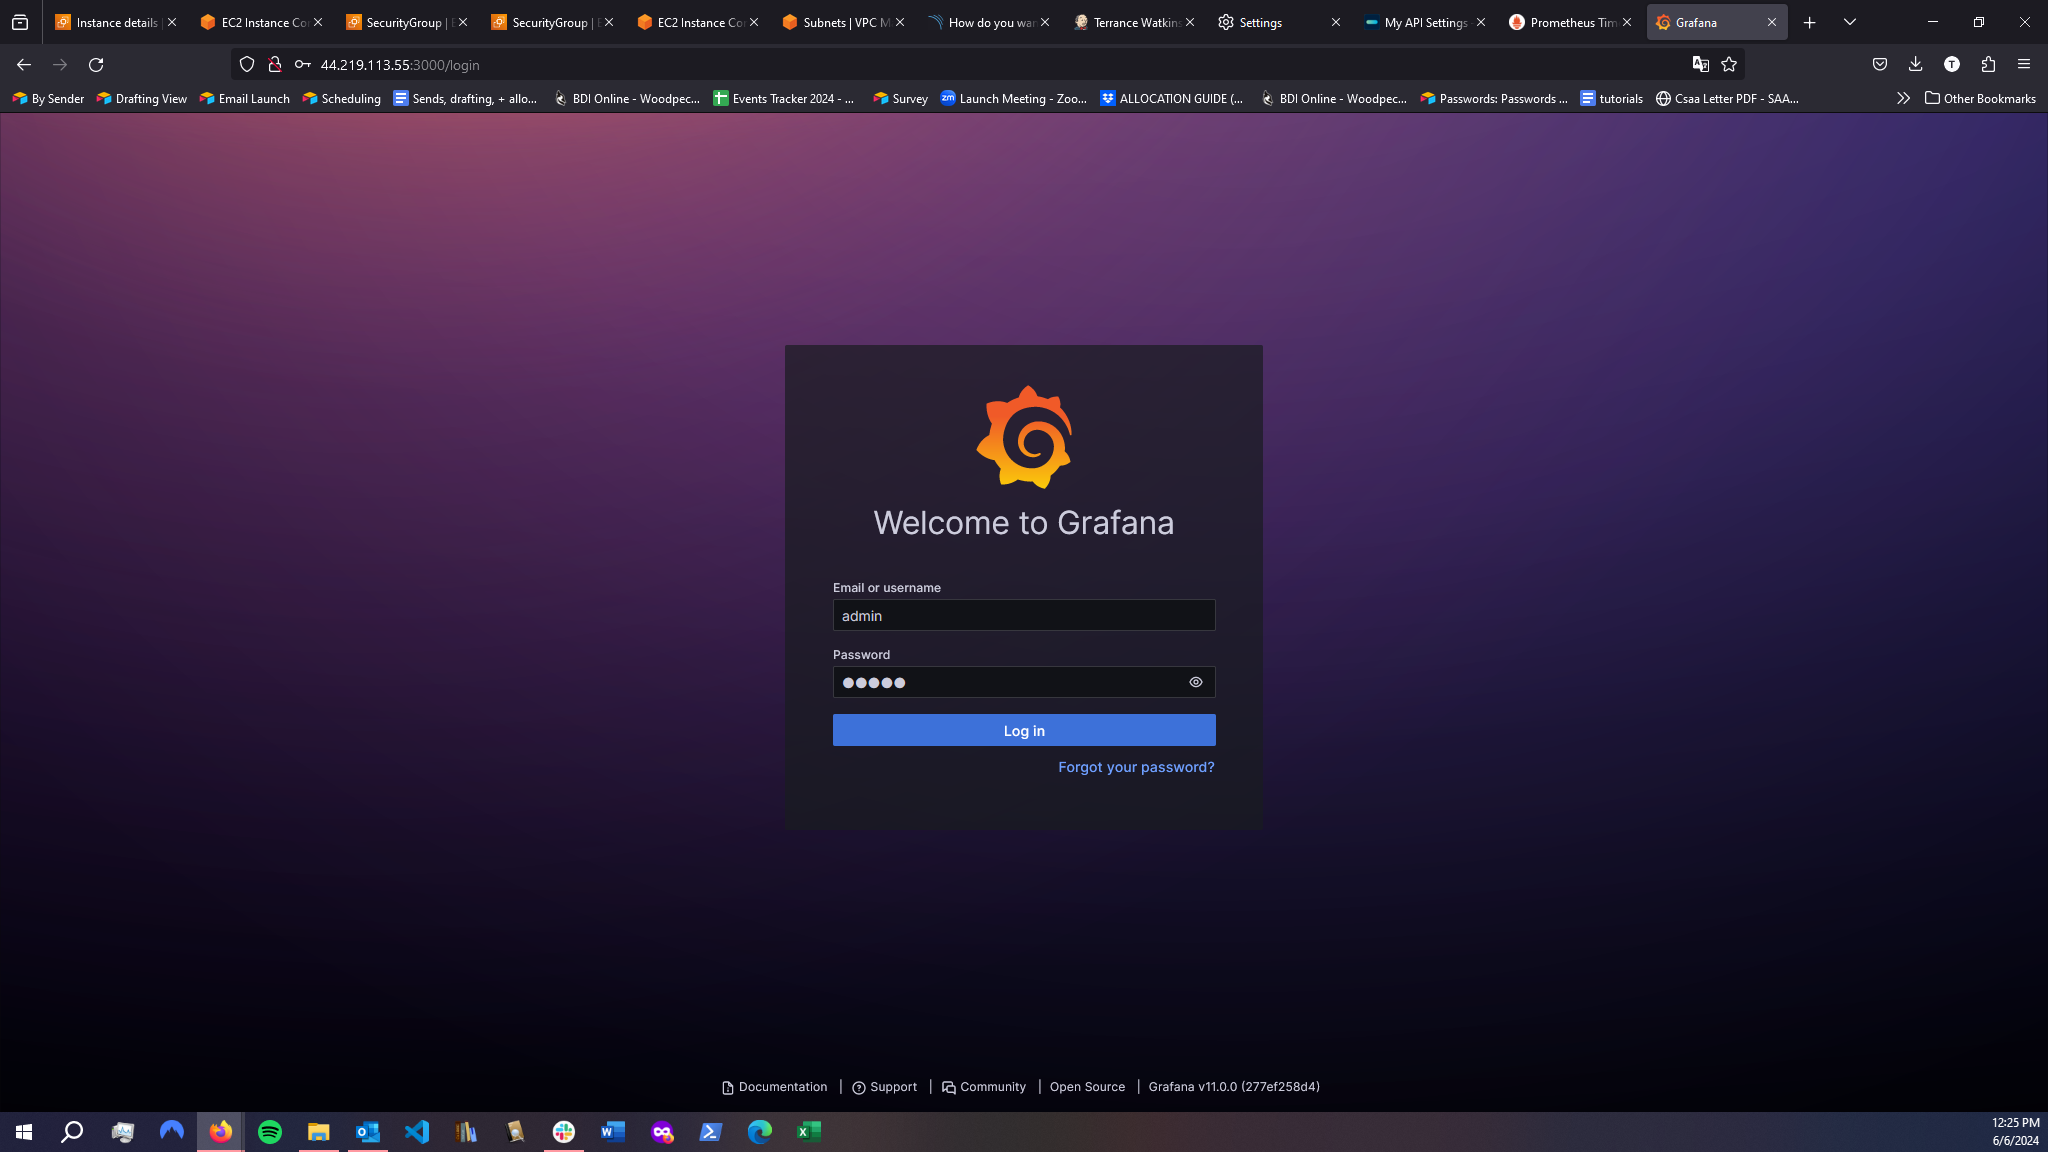
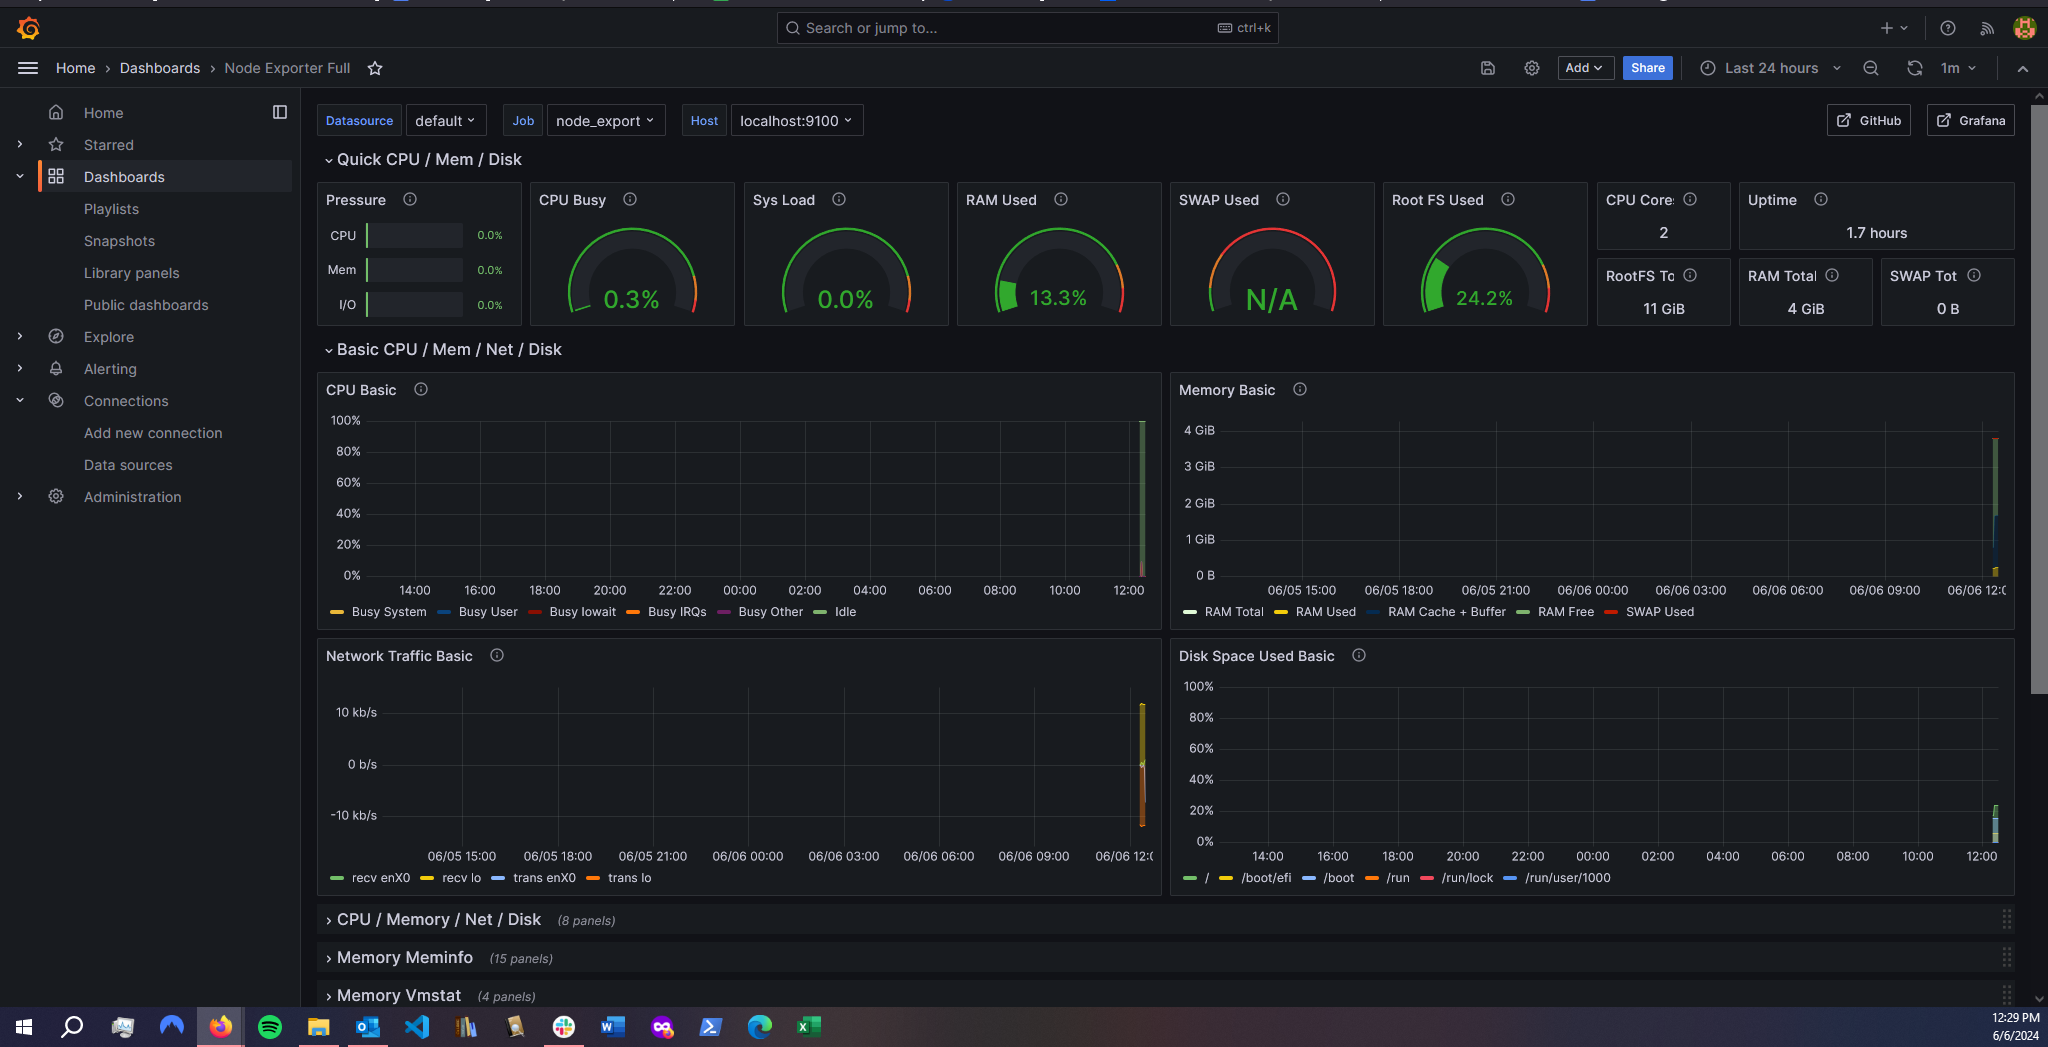
I then needed to install the Prometheus plugin on Grafana. Then add the Dashboard by using the code 1860. Here is the dashboard:
Step 5: Add the Prometheus plugin to Jenkins and integrate it with the Prometheus server
In the Netflix-Jenkins server, I needed to add the Prometheus plugin to Jenkins. Which is Manage Jenkins > Plugins > Available Plugins.
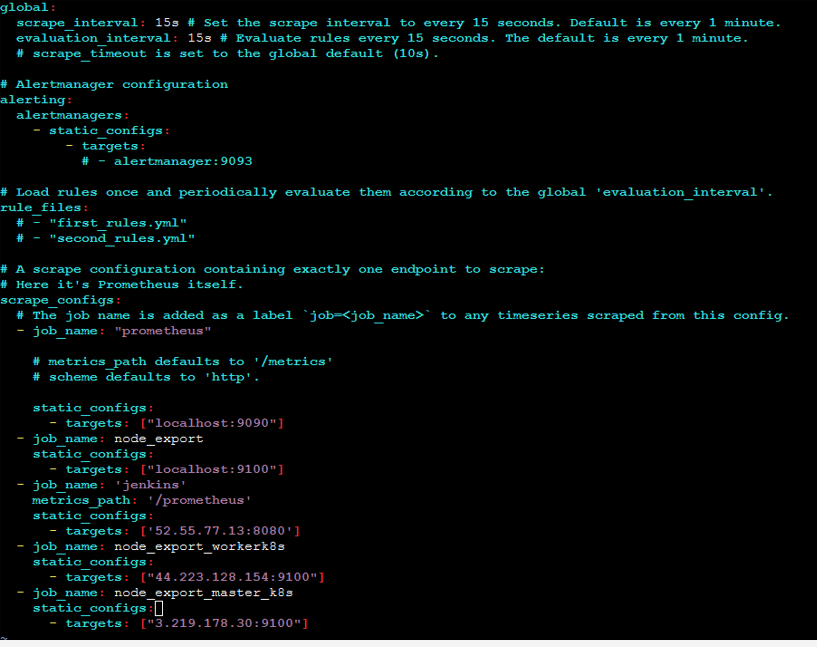
I then had to add another static target to Prometheus’ YAML file:
# my global config
global:
scrape_interval: 15s # Set the scrape interval to every 15 seconds. Default is every 1 minute.
evaluation_interval: 15s # Evaluate rules every 15 seconds. The default is every 1 minute.
# scrape_timeout is set to the global default (10s).
# Alertmanager configuration
alerting:
alertmanagers:
– static_configs:
– targets:
# – alertmanager:9093
# Load rules once and periodically evaluate them according to the global ‘evaluation_interval’.
rule_files:
# – “first_rules.yml”
# – “second_rules.yml”
# A scrape configuration containing exactly one endpoint to scrape:
# Here it’s Prometheus itself.
scrape_configs:
# The job name is added as a label `job=
– job_name: “prometheus”
# metrics_path defaults to ‘/metrics’
# scheme defaults to ‘http’.
static_configs:
– targets: [“localhost:9090”]
– job_name: node_export
static_configs: node export
– targets: [“localhost:9100”]
– job_name: ‘jenkins’
metrics_path: ‘/prometheus’
static_configs:
– targets: [‘52.55.77.13:8080’]
promtool check config /etc/prometheus/prometheus.yml
curl -X POST http://localhost:9090/-/reload

Step 6: Set up email integration in Jenkins and configure the necessary plugins
Next I added my gmail to Jenkins, I needed to grab an access code from Google to use for the SMTP Authentication on Jenkins.
To get to that configuration area on Jenkins you go to Manage Jenkins > System > SMTP Authentication. I added my credentials and selected ‘Use SSL’ port 465.
To verify the mail configuration I needed to go to Manage Jenkins > Credentials > System > Global credentials. Again I added username and password.
Then I selected in the ‘Default Triggers’ for an email which were ‘Always’ and ‘Failure – Any’.
Step 7: Install additional plugins such as JDK, Sonarqube Scanner, and Node.js
Next I went to Jenkins > Plugins > Available Plugins and installed Eclipse Temurin Installer, SonarQube Scanner, and NodeJs.
I then needed to configure the plugins by going to Manage Jenkins > Tools. I had to add JDK with the name ‘jdk17’ and the version was jdk-10.0.8.1 + 1, and for NodeJs the name was ‘node16’ and the version was NodeJS 16.2.0.
The names of the tools will be important when the jenkins pipeline is created.
Step 8: Configure Sonar Server
To integrate SonarQube with Jenkins, I followed these steps:
I grabbed the public IP address of my EC2 instance. Since SonarQube runs on port 9000, I accessed it via
Next, I generated a token in SonarQube. I navigated to my SonarQube server and went to Administration → Security → Users. I clicked on Tokens and then Update Token. I gave the token a name and clicked Generate Token, then copied the generated token.
With the token in hand, I moved over to Jenkins. I opened my Jenkins dashboard, went to Manage Jenkins → Credentials, and added a new secret text credential using the token I copied from SonarQube.
Finally, I configured SonarQube in Jenkins. I went to Dashboard → Manage Jenkins → System and added my SonarQube configuration as shown in the example image (not provided here).
By following these steps, I successfully integrated SonarQube with Jenkins, allowing for continuous code quality inspection.

Step 9: Install OWASP Dependency Check plugins in Jenkins
To integrate the OWASP Dependency-Check plugin with Jenkins, I followed these steps:
First, I installed the OWASP Dependency-Check plugin. I went to the Jenkins dashboard, navigated to Manage Jenkins → Plugins, found the OWASP Dependency-Check plugin, clicked on it, and installed it without restarting Jenkins.
Next, I needed to configure the plugin and the tool. I went to Dashboard → Manage Jenkins → Tools and set up the necessary configurations.
The name was ‘DP-Check’ and the version was dependency-check 6.5.1
By following these steps, I successfully installed and configured the OWASP Dependency-Check plugin in Jenkins, enhancing my project’s security by identifying and reporting known vulnerabilities in project dependencies.
Step 10: Build and push a Docker image
To integrate Docker with Jenkins, I followed these steps:
First, I installed the necessary Docker plugins. I went to the Jenkins dashboard, navigated to Manage Jenkins → Manage Plugins → Available plugins, and searched for Docker. I installed the following plugins without restarting Jenkins:
- Docker
- Docker Commons
- Docker Pipeline
- Docker API
- docker-build-step
Next, I configured Docker in Jenkins. I went to Dashboard → Manage Jenkins → Tools and added my DockerHub username and password under Global Credentials.
By following these steps, I successfully integrated Docker with Jenkins, enabling me to manage and run Docker containers directly from Jenkins.
Step 11: Set up Kubernetes master and slave nodes on Ubuntu 20.04
To configure Kubernetes on Jenkins and set up Node Exporter for monitoring, I followed these steps:
Connecting to the Machines: First, I connected my machines using PuTTY or MobaXterm. I took two Ubuntu 20.04 instances, one for the Kubernetes master and the other for the worker.
Installing Kubectl on the Jenkins Machine: I installed kubectl on the Jenkins machine with the following commands:
sudo apt update
sudo apt install curl
curl -LO https://dl.k8s.io/release/$(curl -L -s https://dl.k8s.io/release/stable.txt)/bin/linux/amd64/kubectl
sudo install -o root -g root -m 0755 kubectl /usr/local/bin/kubectl
kubectl version --client
Setting Hostnames:
On the master node:
sudo hostnamectl set-hostname K8s-Master
On the worker node:
sudo hostnamectl set-hostname K8s-Worker
Installing Docker and Kubernetes on Both Nodes:
sudo apt-get update
sudo apt-get install -y docker.io
sudo usermod -aG docker $USER
newgrp docker
sudo chmod 777 /var/run/docker.sock

sudo apt-get update
sudo apt-get install -y apt-transport-https ca-certificates curl gpg

curl -fsSL https://pkgs.k8s.io/core:/stable:/v1.29/deb/Release.key | sudo gpg --dearmor -o /etc/apt/keyrings/kubernetes-apt-keyring.gpg

echo 'deb [signed-by=/etc/apt/keyrings/kubernetes-apt-keyring.gpg] https://pkgs.k8s.io/core:/stable:/v1.29/deb/ /' | sudo tee /etc/apt/sources.list.d/kubernetes.list

sudo apt-get update
sudo apt-get install -y kubelet kubeadm kubectl
sudo apt-mark hold kubelet kubeadm kubectl
Initializing the Master Node:
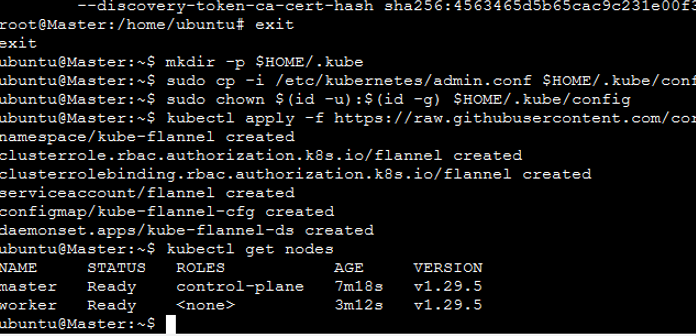
sudo kubeadm init --pod-network-cidr=10.244.0.0/16
# In case you are in root, exit from it and run the below commands
mkdir -p $HOME/.kube
sudo cp -i /etc/kubernetes/admin.conf $HOME/.kube/config
sudo chown $(id -u):$(id -g) $HOME/.kube/config
kubectl apply -f https://raw.githubusercontent.com/coreos/flannel/master/Documentation/kube-flannel.ymlJoining the Worker Node:
sudo kubeadm join 172.31.137.250:6443 --token j2w00o.9zvxfel2f5oawzna \
    --discovery-token-ca-cert-hash sha256:df08c9c06f43f8546ca434ca2a464424594ff86bff7c5e6c43d7f6ce57a94378
Saving the Kubernetes Configuration File: I copied the configuration file to the Jenkins master or local file manager and saved it as secret-file.txt.
Installing the Kubernetes Plugin in Jenkins: After installing the Kubernetes plugin, I went to Manage Jenkins → Manage Credentials → Jenkins Global and added the credentials.
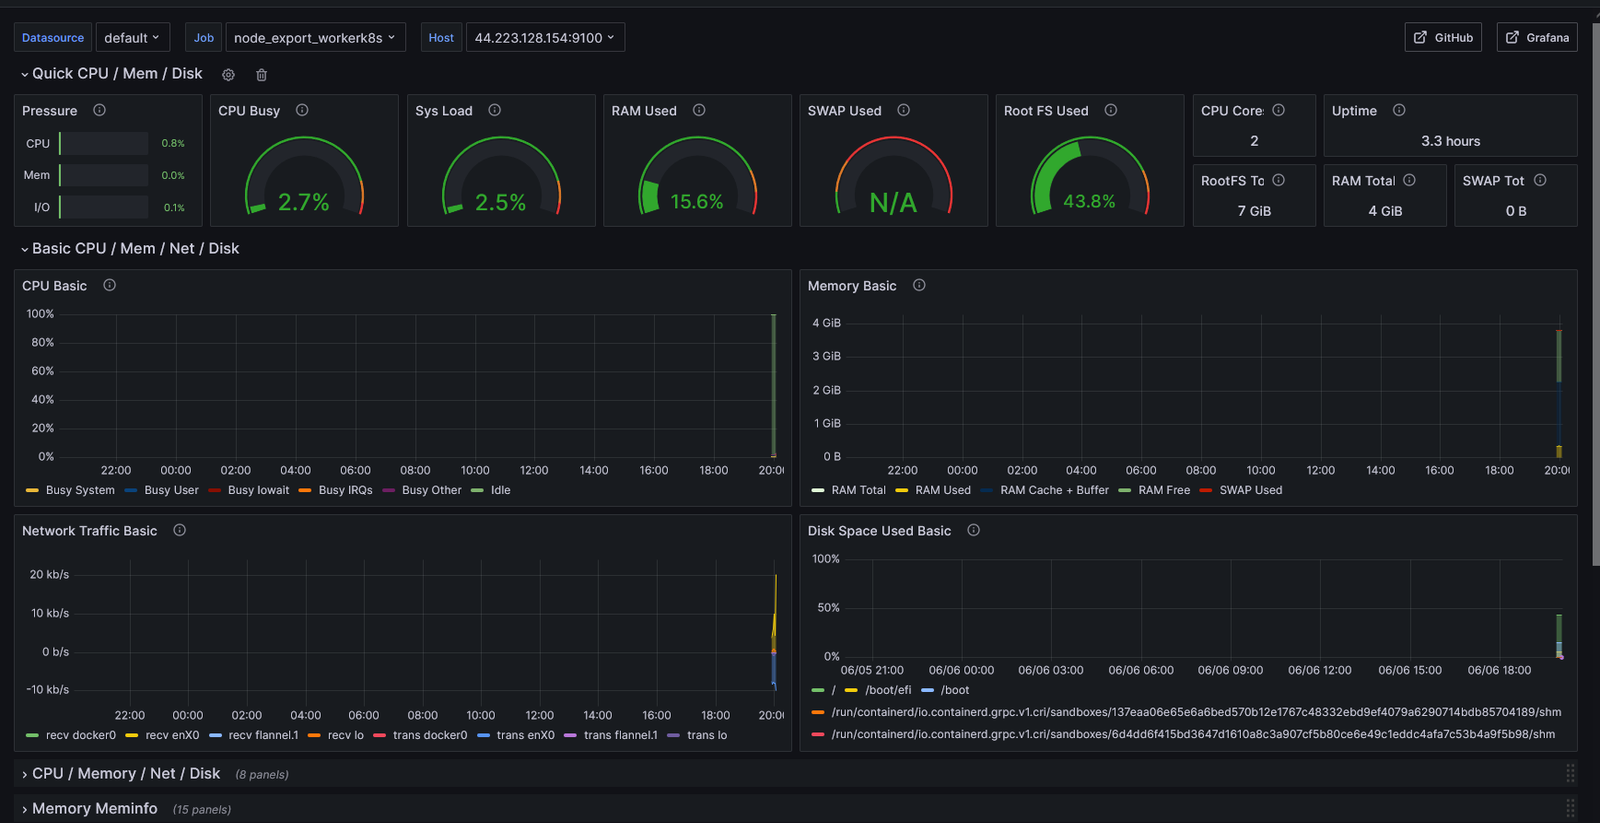
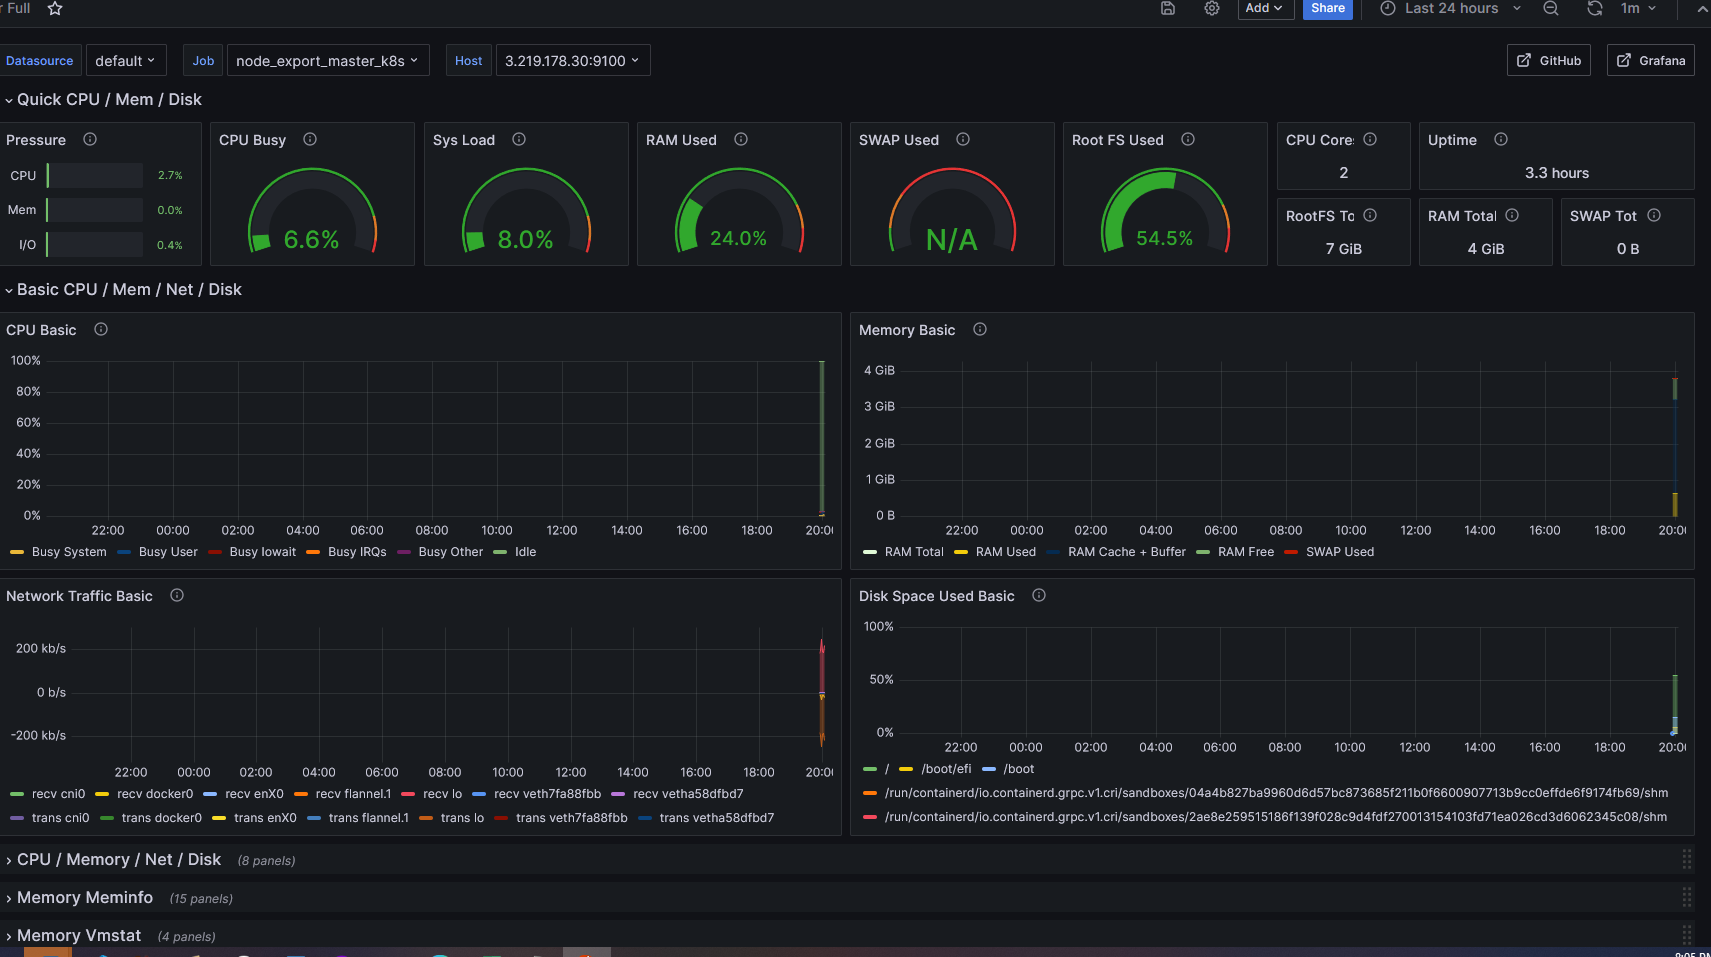
Installing Node Exporter on Both Nodes: I installed Node Exporter on both the master and worker nodes to monitor the metrics.
First, I created a system user for Node Exporter:
sudo useradd --system --no-create-home --shell /bin/false node_exporter
Then, I downloaded and set up Node Exporter:
wget https://github.com/prometheus/node_exporter/releases/download/v1.6.1/node_exporter-1.6.1.linux-amd64.tar.gz
tar -xvf node_exporter-1.6.1.linux-amd64.tar.gz
sudo mv node_exporter-1.6.1.linux-amd64/node_exporter /usr/local/bin/
rm -rf node_exporter*
node_exporter --versionI created a systemd unit file for Node Exporter:
[Unit]
Description=Node Exporter
Wants=network-online.target
After=network-online.target

StartLimitIntervalSec=500
StartLimitBurst=5

[Service]
User=node_exporter
Group=node_exporter
Type=simple
Restart=on-failure
RestartSec=5s
ExecStart=/usr/local/bin/node_exporter --collector.logind

[Install]
WantedBy=multi-user.targetI enabled and started the Node Exporter service:
sudo systemctl enable node_exporter
sudo systemctl start node_exporter
sudo systemctl status node_exporter
Configuring Prometheus for Node Exporter
I edited the Prometheus configuration file:
sudo vim /etc/prometheus/prometheus.yml
I checked the configuration and reloaded Prometheus:
promtool check config /etc/prometheus/prometheus.yml
curl -X POST http://localhost:9090/-/reload
By following these steps, I successfully set up Kubernetes on Jenkins with Node Exporter for monitoring, ensuring a robust environment for managing and monitoring Kubernetes clusters.
In the Master Node I gave this command:
kubectl get all
kubectl get svc #use anyone
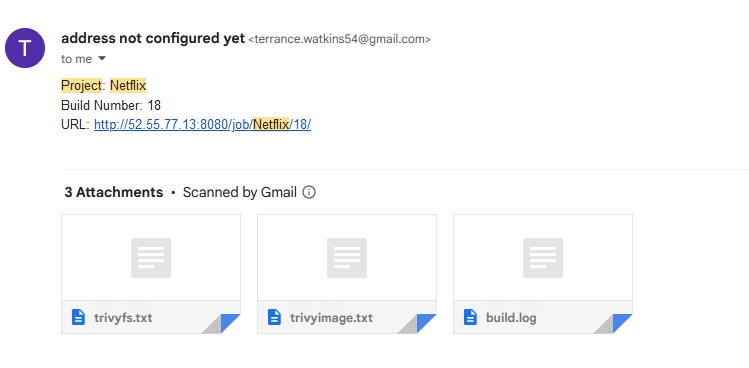
Here is the Build Log and Pipeline Script
Challenges and Solutions
Throughout this project, I encountered several challenges that required troubleshooting and iterative improvement:
- Workspace File Not Found: The Jenkins workspace file was initially missing. I had to create the workspace directory for the Jenkins server manually.
- Security Group Misconfigurations: I did not have the correct ports open in the AWS security groups, which prevented proper communication between services. Adjusting the security group settings resolved these issues.
- Joining Worker to Master Cluster: I faced issues with joining the Kubernetes worker node to the master. This was resolved by ensuring that both nodes were correctly configured and the necessary tokens and hashes were used.
- Pipeline Script Errors: The pipeline script had several syntax and indentation errors, which caused multiple failures. Careful debugging and adherence to indentation rules helped fix these issues.
- Docker Authentication Issues: Initially, I could not sign into Docker using Jenkins credentials. The solution was to use an access token from Docker Hub instead of a password.
Conclusion
This project was a comprehensive exercise in deploying a complex application using various modern DevOps tools and practices. It provided hands-on experience with setting up a CI/CD pipeline, containerizing an application, orchestrating it with Kubernetes, and monitoring the entire stack with Prometheus and Grafana. Each stage of the project introduced new challenges and learning opportunities, making it a valuable addition to my portfolio.
By solving configuration problems and ensuring seamless integration of various services, I gained a deeper understanding of the intricacies of managing and deploying modern cloud-native applications. This project demonstrates my technical skills and ability to troubleshoot and continuously improve complex systems.
The total time to complete this project was 11 hours, but I really enjoyed learning about new technologies in my cloud journey.